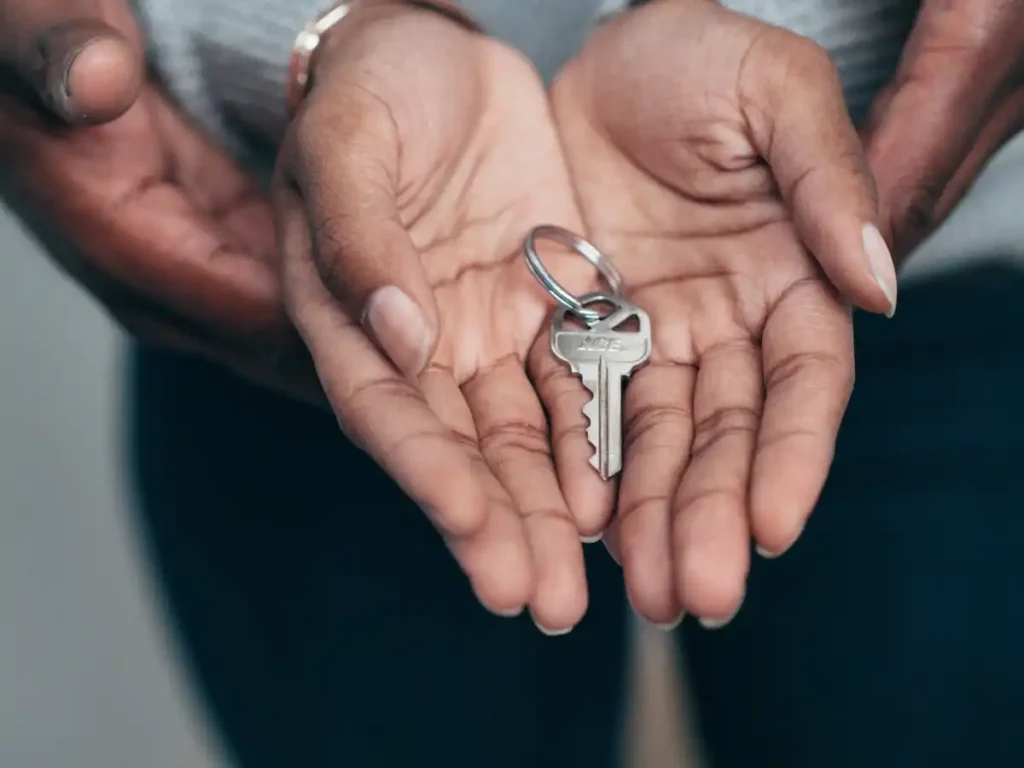
Are Black Americans being locked out of the American dream of homeownership?

by Shadi Bushra
Fifty years after Martin Luther King Jr.’s “I Have a Dream” speech, that dream of equality remains far from realized for too many Black Americans. And, according to the latest data, aspects of that dream are actually more elusive than it was during King’s historic March on Washington.
In 1960, it was legal to refuse to sell a house to someone because of their race. Yet there was still more parity between Black and white homeowners at that time than there is today, over 60 years later. The gap between Black and white homeownership rates that year was 27 percentage points. In the first half of 2022, that gap was over 29 percentage points.
To fully appreciate how detrimental the gap is, we have to remember that homeownership in the United States guarantees more than just shelter. According to the Federal Reserve, homeowners have nearly 12 times as much wealth as renters, with an average of $1.1 million compared to renters’ average wealth of just $95,000.
Low rates of homeownership then put Blacks at a disadvantage in terms of overall wealth as well. The fact that such a relatively small percentage of Black families own a home today is an indication of less wealth overall, and less ability to transfer intergenerational wealth to their children. And, of course, equity in a home can provide a financial buffer in an emergency.
There are arguments against the ‘homeownership society‘ that we have pursued since the end of World War II. But, like it or not, we live in a world where owning a home tends to amplify your political voice, strengthen your economic foundation, and provide you with social capital. So if owning a home is a part of the American Dream, why are Black Americans being left out of it?
To understand why, Today’s Homeowner analyzed data from the U.S. Census Bureau on Black and white homeownership rates at the national level from 1994 through the first half of 2022, and at the state and city level from 2010 through 2021. We looked at data from all 50 states and the District of Columbia, and from nearly 300 cities that had figures available from 2010 to 2021. Here’s what we learned.


